Condominiums and Townhomes in High Demand Across Metro Vancouver
Demand for condominiums and townhomes continues to drive the Metro Vancouver* housing market.
Residential property sales in the region totalled 3,553 in April 2017, a 25.7 per cent decline compared to April 2016 when 4,781 homes sold and a 0.7 per cent decrease from the 3,579 sales recorded in March 2017.
April sales were 4.8 per cent above the 10-year average for the month.
For the first four months of the year, condominium and townhome sales have comprised a larger percentage of all residential sales on the Multiple Listing Service® (MLS®) in Metro Vancouver. Over this time, they’ve accounted for 68.5 per cent, on average, of all residential sales. This is up 10 per cent from the 58.2 per cent average over the same period last year.
“Our overall market is operating below the record-setting pace from a year ago and is in line with historical spring levels. It’s a different story in our condominium and townhome markets,” Jill Oudil, Real Estate Board of Greater Vancouver (REBGV) president said. “Demand has been increasing for months and supply is not keeping pace. This dynamic is causing prices to increase and making multiple offer scenarios the norm.”
New listings for detached, attached and apartment properties in Metro Vancouver totalled 4,907 in April 2017. This represents a decrease of 19.9 per cent compared to the 6,127 units listed in April 2016 and a three per cent increase compared to March 2017 when 4,762 properties were listed.
The total number of residential properties currently listed for sale on the MLS® system in Metro Vancouver is 7,813, a 3.5 per cent increase compared to April 2016 (7,550) and a three per cent increase compared to March 2017 (7,586).
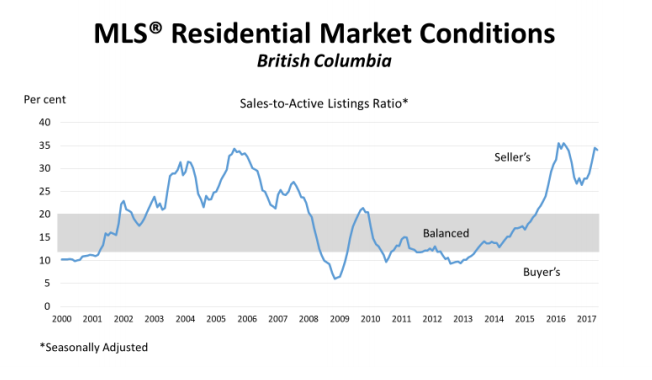
The sales-to-active listings ratio for April 2017 is 45.5 per cent for all property types. This is two per cent below March 2017 and is indicative of a sellers’ market. Generally, analysts say that downward pressure on home prices occurs when the ratio dips below the 12 per cent mark for a sustained period, while home prices often experience upward pressure when it surpasses 20 per cent over several months.
By property type, the sales-to-active listings ratio is 26 per cent for detached homes, 58.2 per cent for townhomes, and 82.2 per cent for condominiums.
“Until more entry level, or ‘missing middle’, homes are available for sale in our market, we’ll likely continue to see prices increase,” Oudil said. “There’s been record building this past year, but much of that inventory isn’t ready to hit the market.”
The MLS® Home Price Index composite benchmark price for all residential properties in Metro Vancouver is currently $941,100. This represents a five per cent increase over the past three months and an 11.4 per cent increase compared to April 2016.
Over the last three months, the benchmark price of condominiums has seen the largest increase in the region at 8.2 per cent, followed by townhomes at 5.3 per cent, and detached homes at 2.8 per cent.
“Home buyers are looking to get into the market and they’re facing fierce competition,” Oudil said. “It’s important to work with your local Realtor to help you navigate today’s marketplace.”
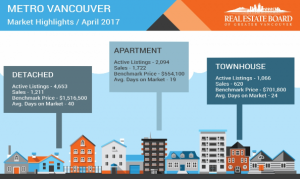
Sales of detached properties in April 2017 reached 1,211, a decrease of 38.8 per cent from the 1,979 detached sales recorded in April 2016. The benchmark price for detached properties is $1,516,500. This represents an 8.1 per cent increase over the last 12 months and a 1.8 per cent increase compared to March 2017.
Sales of apartment, or condominium, properties reached 1,722 in April 2017, a decrease of 18.3 per cent compared to the 2,107 sales in April 2016.The benchmark price of an apartment property is $554,100. This represents a 16.6 per cent increase over the past 12 months and a 3.1 per cent increase compared to March 2017.
Attached, or townhome, property sales in April 2017 totalled 620, a decrease of 10.8 per cent compared to the 695 sales in April 2016. The benchmark price of an attached unit is $701,800. This represents a 15.3 per cent increase over the past 12 months and a 2.4 per cent increase compared to March 2017.
Download the full April 2017 stats package here.
 The British Columbia Real Estate Association (BCREA) reports that a total of 12,402 residential unit sales were recorded by the Multiple Listing Service® (MLS®) in May, down 7.9 per cent from the same period last year. Total sales dollar volume was $9.33 billion, down 4.0 per cent from May 2017. The average MLS® residential price in the province was $752,536, a 4.2 per cent increase from the same period last year.